Hi All,
This walkthrough describes how you can use OData to combine data from Microsoft Dynamics NAV 2016 with data from Microsoft Azure Marketplace
Prerequisite:
1) Microsoft Excel 2013 with Microsoft PowerPivot enabled, or Microsoft Excel 2010 with the PowerPivot add-in for Excel 2010 installed.
2) A Microsoft account for accessing data from Azure Marketplace. For more information about Microsoft account, see the What is a Microsoft account?. To obtain a Microsoft account, go to the sign-up page
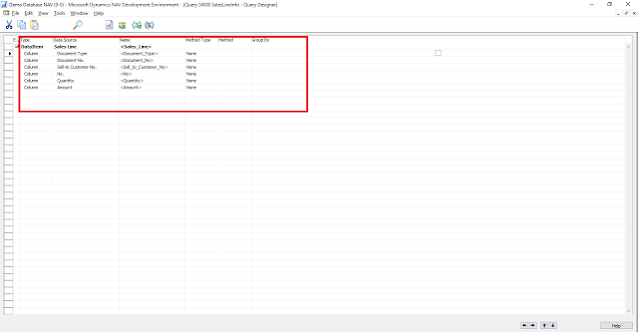
Create Sales Line table Query as shown below with needed fields to publish it as a web service.
We need to publish a Customer Page as well as a Web service.
I will not go in detail of Publishing the web service and using the OData Web Service in Excel Powerpivot. You can refer my below post for detailed explanation on the same.
https://nandeshgowda-navblog.blogspot.in/2016/09/viewing-page-data-in-excel-using.html
We will Concentrate on Importing Data from Azure Marketplace
Importing Data from Azure Marketplace
The Azure Marketplace is an online market where you can buy and sell finished Software as a Service (SaaS) applications and premium datasets.
The Azure Marketplace offers many different kinds of data, including demographic, environment, financial, retail, and sports data.
In this walkthrough, you use demographic data about development standards in different countries and regions

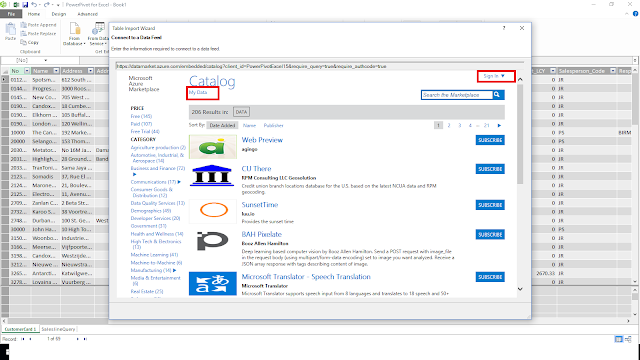
This opens a web page titled Microsoft Azure Marketplace Catalog which shows the available Azure Marketplace datasets.
After you are signed up, choose Data to return to the list of available datasets.


Thanks & Regards,
Nandesh Gowda
This walkthrough describes how you can use OData to combine data from Microsoft Dynamics NAV 2016 with data from Microsoft Azure Marketplace
Prerequisite:
1) Microsoft Excel 2013 with Microsoft PowerPivot enabled, or Microsoft Excel 2010 with the PowerPivot add-in for Excel 2010 installed.
Create Sales Line table Query as shown below with needed fields to publish it as a web service.

We need to publish a Customer Page as well as a Web service.
I will not go in detail of Publishing the web service and using the OData Web Service in Excel Powerpivot. You can refer my below post for detailed explanation on the same.
https://nandeshgowda-navblog.blogspot.in/2016/09/viewing-page-data-in-excel-using.html
We will Concentrate on Importing Data from Azure Marketplace
Importing Data from Azure Marketplace
The Azure Marketplace is an online market where you can buy and sell finished Software as a Service (SaaS) applications and premium datasets.
The Azure Marketplace offers many different kinds of data, including demographic, environment, financial, retail, and sports data.
In this walkthrough, you use demographic data about development standards in different countries and regions
- In PowerPivot, on the Home tab, in the Get External Data, choose From Data Service, and then choose From (Windows) Azure Marketplace.

This opens a web page titled Microsoft Azure Marketplace Catalog which shows the available Azure Marketplace datasets.
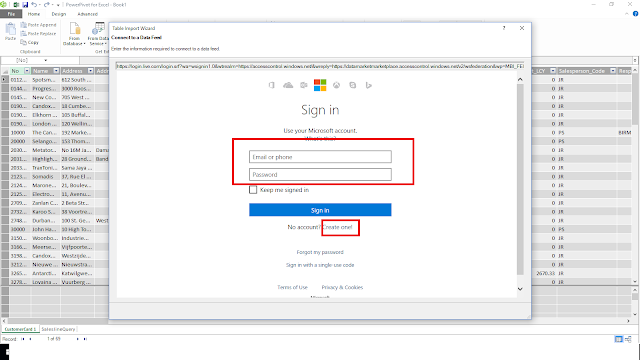
- Choose My Data and use your Microsoft account to create a free Azure Marketplace account.

After you are signed up, choose Data to return to the list of available datasets.

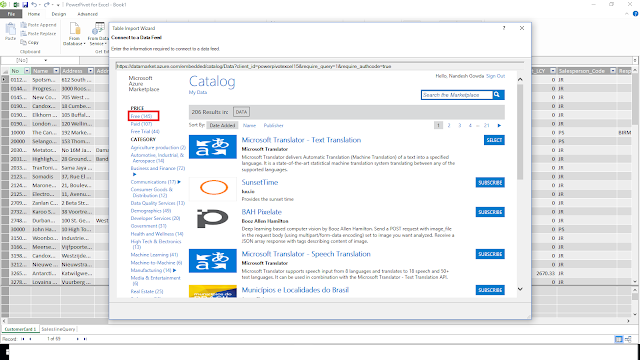
- In the left panel, choose Free, choose Demographics, and then scroll down to choose World Development Indicators.


- Read about the dataset, and then choose SIGN UP to subscribe to this data feed. On the Subscription page, choose SIGN UP again.


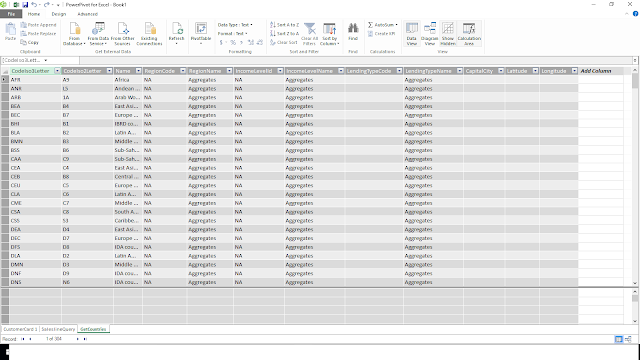
- Now you can see GetCountries Worksheet

- You can create a relationship between all the 3 sheets and use it to develop Pivot table and analyze data.


Thanks & Regards,
Nandesh Gowda
No comments:
Post a Comment